Contributors:
Amol Ghemud Published: October 15, 2026
Summary
The Google Ads budget calculator on this page takes five inputs, your target leads or sales, average CPC, conversion rate, ROAS target, and monthly revenue goal, and returns a data-backed monthly spend figure in under two minutes. Most Indian and GCC advertisers over- or under-spend by 30 to 60 percent simply because they start with a budget and work backward to a goal instead of the reverse. Fixing that single sequencing error is the structural change behind every scaled Google Ads account that actually holds its efficiency.
In This Article
Share On:
A fintech founder in Pune came to upGrowth Digital asking why their Google Ads account was burning Rs 4 lakh a month with 11 qualified leads to show for it. The creatives were fine. The keywords were reasonable. The bidding strategy was textbook. The problem was that the budget had been set by rounding up a competitor estimate, with zero connection to their actual cost-per-acquisition target. Budget was the starting point. It should have been the output.
That sequencing error is more common than most paid media teams admit. You pick a number that feels safe, launch campaigns, and then reverse-engineer a goal that fits the spend. The math runs backward, and the results follow. When Lendingkart came to upGrowth, total conversions were sitting at 56K. By anchoring every budget decision to a conversion target rather than an arbitrary ceiling, we grew that to 87K conversions, a 54% increase, alongside 20% business growth. The structural change was not the ad copy. It was the order of operations.
The Google Ads budget calculator below is built on the same logic. Enter your goals, and the calculator tells you what to spend. Not the other way around. What follows is the framework behind every input field so your number has a defensible rationale before you open Campaign Manager.
How the Google Ads Budget Calculator Works
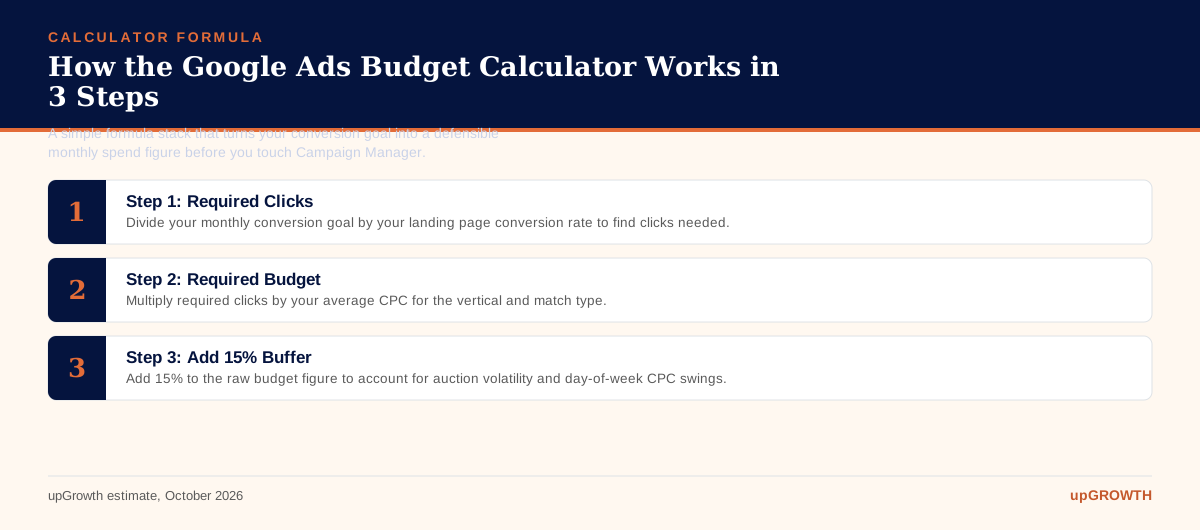
The calculator runs on three formulas stacked in sequence. Required Clicks = Monthly Conversion Goal / Landing Page Conversion Rate.Required Budget = Required Clicks x Average CPC. Then add a 15% buffer for auction volatility, because Google’s auction clears differently on Mondays than on Sundays, and your forecasted CPC is a median, not a ceiling.
The five inputs are: your monthly conversion goal (leads or revenue-generating transactions), your target CPA or ROAS, your expected landing page conversion rate, the average CPC for your vertical and match type, and the number of campaign days active in the month. Each input is a lever. Change one and the budget output shifts proportionally. That is the point. It makes the relationship between ambition and spend visible before any money moves.
What the calculator does not replace is equally important to state clearly. It does not optimize your Quality Score, which directly affects your actual CPC versus the benchmark you enter. It does not fix a landing page converting at 0.9% when the vertical median is 2.35%. And it does not replace keyword-level bid strategy. Per Google Search Central documentation, ad relevance and expected click-through rate are core Quality Score components. A QS improvement from 4 to 7 on your primary keyword can drop your effective CPC by 30 to 45%, which means the calculator output shrinks by that same margin. Fix QS first, then budget.
What Is a Realistic Google Ads Budget for Indian and GCC Markets in 2026?
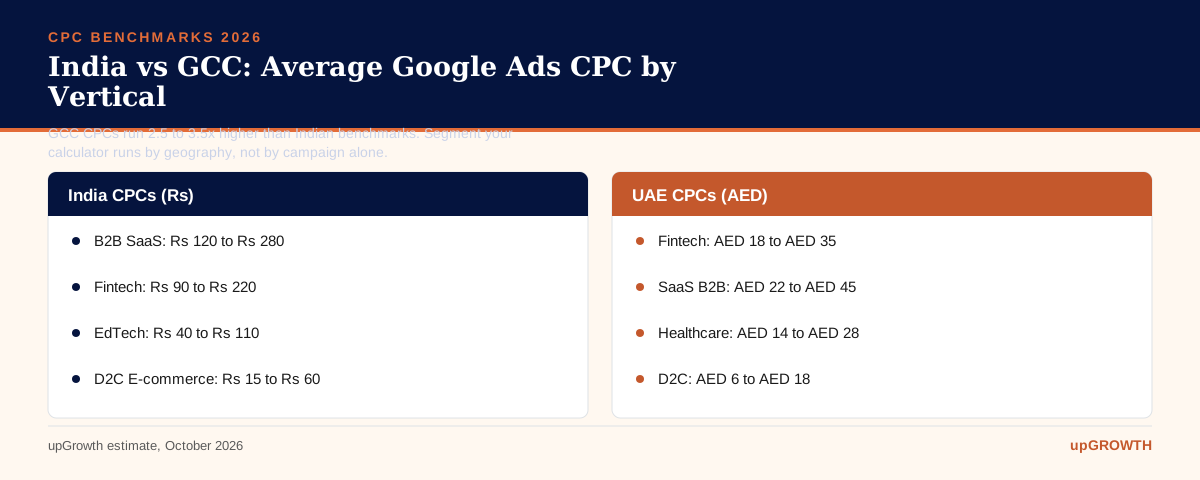
Benchmarks matter because “average CPC” means very different things depending on the vertical and the geography. In India, B2B SaaS keywords clear at Rs 120 to Rs 280 per click on branded and high-intent terms. Fintech runs Rs 90 to Rs 220. EdTech sits lower at Rs 40 to Rs 110. D2C e-commerce on Shopping campaigns can be as low as Rs 15 to Rs 60. Healthcare and diagnostics land between Rs 60 and Rs 160 depending on the query specificity.
GCC is a different market entirely. UAE and Saudi advertiser density drives CPCs 2.5 to 3.5 times higher in AED terms compared to equivalent Indian rupee benchmarks. UAE fintech CPCs regularly exceed AED 18 to AED 35 per click on competitive queries. If you are running campaigns across both geographies from a single account, blending your CPC input is a mistake. Segment the calculator run by market.
On minimum viable test budgets: the rule of thumb from Google Ads Help documentation is that Smart Bidding strategies need roughly 30 conversions per month to begin optimizing meaningfully. Reverse-engineer from that threshold. If your target CPA is Rs 2,000 and you want 30 conversions, your minimum test budget is Rs 60,000, plus the 15% volatility buffer, which puts you at Rs 69,000. That is your floor, not Rs 50K because it feels like a round number.
The 5 Inputs That Determine Your Ideal Monthly Spend
Each input carries a different failure mode. Understanding where advertisers get each one wrong is more useful than a generic “enter your data” walkthrough.
Input 1: Monthly conversion goal. Tie this to a revenue number, not a form fill. If you are B2B, use your SQL-to-lead ratio. If 1 in 7 marketing-qualified leads becomes a sales-qualified lead, and you need 5 SQLs per month, your MQL target is 35. That is what goes into the calculator, not 5.
Input 2: Average CPC. Pull from Google Keyword Planner, your own historical data at the match-type level, or the vertical benchmarks above. The word “guess” should not appear in your process here. Aspirational CPCs produce insufficient budgets. Inflated CPCs produce unnecessarily conservative ones.
Input 3: Landing page conversion rate. Industry median for Google Ads sits at 2.35%, with the top quartile above 5.31%, according to widely cited Search Engine Land analysis of WordStream’s benchmark data. Know where your page stands before you touch the budget field. A 1% CVR and a 4% CVR on the same keyword produce budgets that differ by 4x.
Input 4: Target CPA or ROAS. For B2B SaaS, acceptable CPAs often range Rs 800 to Rs 4,000 depending on deal size and sales cycle. For D2C, a ROAS floor of 3x to 5x is common. If you cannot name your CPA target, you are not ready to set a budget. Full stop.
Input 5: Campaign days active. A 22-day active window versus a 30-day window compresses your delivery and requires a higher daily cap to hit the same monthly conversion goal. The calculator accounts for this automatically when you enter active days, but most manual budgeters miss it entirely.
Common Budget Sizing Mistakes That Inflate Wasted Spend
Show me a Google Ads account where budget was set before CPA target was defined, and I will show you an account with impression share loss above 35% and a CFO asking uncomfortable questions at the quarterly review.
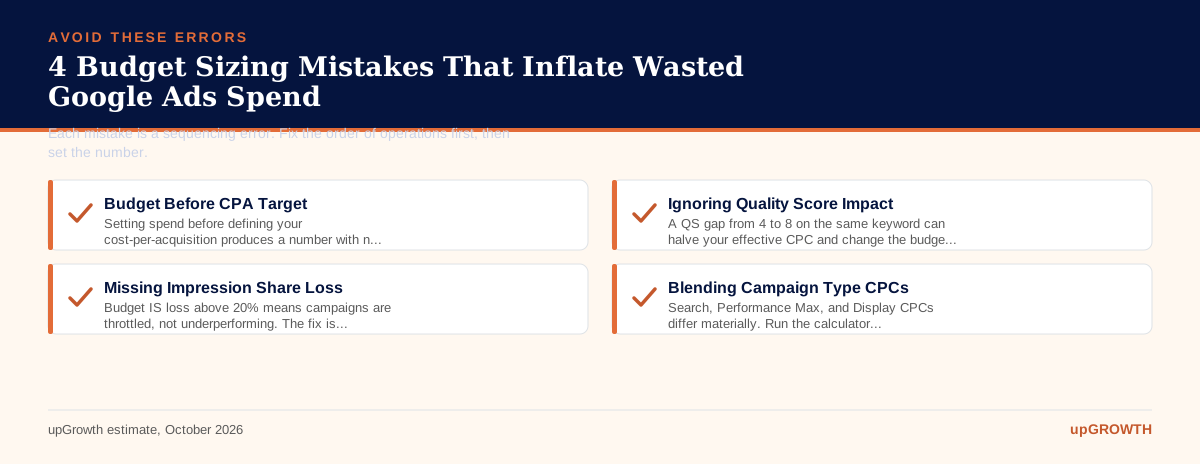
Mistake 1: Setting budget before CPA target. Budget is the output of a CPA model, not the input. Every other error on this list flows from this one. The Pune fintech founder’s Rs 4 lakh account is exhibit A.
Mistake 2: Using industry-average CPC without accounting for Quality Score. A QS of 4 versus 8 on the same keyword can effectively double your CPC at auction. If you enter a benchmark CPC without knowing your QS, the calculator is working with a corrupted input. Per Ahrefs’ paid search analysis, QS-driven CPC gaps of 40 to 60% are common in competitive verticals.
Mistake 3: Ignoring Impression Share lost to budget. If Google reports your Budget Impression Share loss above 20%, your creative and keywords may be entirely healthy. Your daily cap is artificially strangling delivery. You are leaving conversions on the table while simultaneously being confused about why volume is low. The fix is not better keywords. It is a budget increase, which the calculator would have told you upfront if you had used it.
Mistake 4: Treating campaign types identically. Search, Performance Max, Display, and Demand Gen campaigns have fundamentally different CPCs, conversion windows, and attribution behaviors. A blended CPC input across campaign types produces a budget that fits none of them precisely. Run the calculator separately for each campaign type and then aggregate.
How to Stress-Test Your Budget Output Before Going Live
A calculator output is a hypothesis. The 14-day pilot is how you test it without betting the full monthly budget on assumptions that may not survive contact with a live auction.
Run a 14-day manual CPC pilot at 30% of the calculator-output budget to validate your CPC and CVR assumptions. If the calculator says Rs 1,20,000 per month, your pilot runs at Rs 36,000 over 14 days. At the end, you have real CPC and CVR data from your account. Plug those into the calculator and recalculate. If the revised output is within 20% of the original, your assumptions were solid. If it diverges by more, you have discovered something valuable before losing the full budget.
Set a CAC ceiling alert in Google Ads scripts or Looker Studio so automated rules pause campaigns if CPA exceeds your target by more than 25% for more than 3 consecutive days. This prevents a bad audience signal from compounding.
Compare the calculator output against your LTV:CAC ratio before treating the output as conservative or aggressive. If your customer LTV is Rs 60,000 and acceptable payback is 6 months, a CPA of up to Rs 10,000 is entirely defensible even if it looks alarming in isolation. The calculator gives you the budget number. Your LTV math tells you whether that number is actually a problem or just feels like one.
Scaling Your Google Ads Budget Without Losing Efficiency
The 20% rule is not a suggestion. Increase budgets in increments no larger than 20% per week. Larger jumps trigger Smart Bidding re-learning periods that inflate CPA for 7 to 14 days while the algorithm recalibrates its conversion probability models. Patience here is a performance lever, not a limitation.
Horizontal scaling, adding new ad groups, keyword themes, and audience segments, carries lower risk than vertical scaling, simply raising daily budgets on existing campaigns. Horizontal growth expands your addressable query pool. Vertical growth just bids more aggressively for the same queries you are already winning or losing.
Use Search Impression Share and Auction Insights to identify where competitors are outspending you on high-intent queries, then shift budget from low-intent ad groups to high-intent ones before adding net-new spend. Budget reallocation often outperforms budget addition in efficiency terms. Lendingkart’s path from 56K to 87K conversions was phased, tied to CPL gates, not calendar dates.
Google Ads Budget Calculator vs Manual Estimation: Which Should You Trust?
The honest answer: neither, in isolation. A calculator is only as accurate as its inputs. Manual estimation fails when advertisers substitute aspirational figures for actual account data. The calculator wins on one specific dimension: it removes HiPPO bias (Highest Paid Person’s Opinion) from budget conversations. When the CMO insists on Rs 2 lakh per month and the calculator says Rs 87,000 based on the agreed CPA target, there is a formula in the room. That changes the conversation.
For new accounts with no historical data, use the calculator with conservative inputs: top-of-range CPC for your vertical and a pessimistic CVR of 2 to 3%. Overestimating CVR is the single most common reason calculator-derived budgets prove insufficient in the first month. Revisit and recalibrate every 30 days as real account data replaces the benchmarks you started with.
Google Ads Budget Calculator: Vertical CPC and Minimum Budget Benchmarks, India 2026
Vertical
Avg CPC Range (Rs)
Median CVR
Min. Monthly Budget for 30 Conversions
B2B SaaS
Rs 120 to Rs 280
2.5%
Rs 1,38,000 to Rs 3,22,000
Fintech
Rs 90 to Rs 220
2.3%
Rs 1,17,000 to Rs 2,87,000
EdTech
Rs 40 to Rs 110
3.1%
Rs 38,700 to Rs 1,06,500
D2C E-commerce
Rs 15 to Rs 60
2.0%
Rs 22,500 to Rs 90,000
Healthcare
Rs 60 to Rs 160
3.5%
Rs 51,400 to Rs 1,37,100
Common Questions About the Google Ads Budget Calculator
How much should I spend on Google Ads per month in India in 2026?
There is no universal floor, but a meaningful test requires enough budget to generate at least 30 conversions per month so Smart Bidding can optimize. For most Indian B2B SaaS verticals, that means a minimum of Rs 60,000 to Rs 1,50,000 per month depending on your target CPA and keyword CPC range. D2C brands with lower CPCs and higher conversion rates can get useful data from Rs 30,000 to Rs 50,000 per month. Use the calculator above with your own CPA target to arrive at a defensible number.
What is a good ROAS target for Google Ads in 2026?
A ROAS of 3x to 5x is the common floor for D2C e-commerce, meaning Rs 3 to Rs 5 in revenue for every Rs 1 spent on ads. B2B SaaS companies typically target a pipeline-weighted ROAS of 8x to 15x over a 90-day attribution window because deal cycles are longer. GCC advertisers running UAE or Saudi campaigns should benchmark against local CAC norms, which run higher due to competitive CPC density. Your ROAS target should always be derived from your gross margin and LTV, not from industry averages alone.
How do I calculate my Google Ads daily budget from a monthly budget?
Divide your monthly budget by 30.4 (Google’s standard month length). For example, a Rs 90,000 monthly budget equals a Rs 2,960 daily budget. Note that Google may spend up to 2x your daily budget on high-traffic days, but will not exceed your monthly total. Always set a monthly budget cap in Campaign Manager as a safeguard in addition to the daily budget figure.
Can a Google Ads budget calculator work for Performance Max campaigns?
Yes, but with an important adjustment. Performance Max campaigns aggregate Search, Display, YouTube, Gmail, and Shopping inventory, so your average CPC input should reflect the blended CPC across all those channels, not just Search. In practice, PMax blended CPCs are often 20 to 40 percent lower than pure Search CPCs but conversion rates also vary. Run the calculator with a conservative blended CVR of 1.5 to 2.5 percent and validate against your first 30 days of PMax data.
What conversion rate should I use in the Google Ads budget calculator?
Use your actual account conversion rate if you have 90 or more days of clean data. If you are starting fresh, use a conservative vertical benchmark: 2 to 3.5 percent for B2B lead gen, 1.5 to 3 percent for e-commerce, and 3 to 6 percent for high-intent local services. WordStream data from 2026 puts the median Google Ads conversion rate across all industries at approximately 2.35 percent. Overestimating CVR is the single most common reason calculator-derived budgets prove insufficient in practice.
How often should I recalibrate my Google Ads budget?
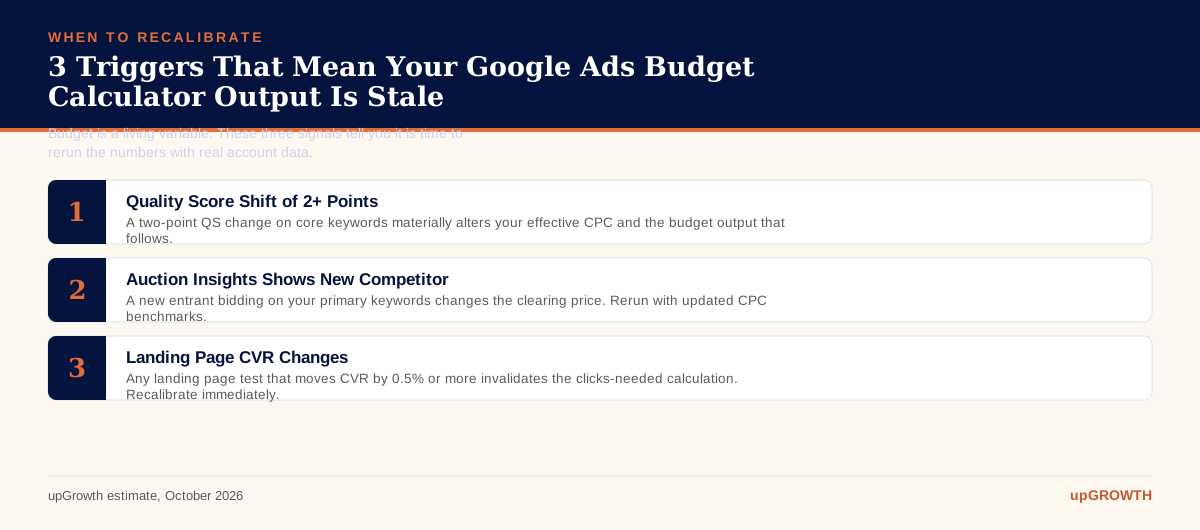
Recalibrate every 30 days using actual CPC and CVR data from your account rather than the benchmarks you used to set the initial budget. Significant triggers for an immediate recalibration include a Quality Score shift of 2 or more points on core keywords, a seasonal demand spike (monitored via Google Trends), a competitive entry into your auction (visible in Auction Insights), or a landing page change that materially affects conversion rate. Budget is a living variable, not a quarterly setting.
Is a free Google Ads budget calculator accurate enough to use for enterprise accounts?
For enterprise accounts spending Rs 10 lakh or more per month, the calculator provides a directional sanity check rather than a final number. At that scale, budget allocation decisions should be informed by attribution modeling, incrementality testing, and portfolio-level CPA analysis across campaign types. That said, the calculator remains useful for stress-testing individual campaign budgets within a larger portfolio and for briefing finance stakeholders who need a formula-driven rationale for spend requests.
Your Next Move: Get a Custom Google Ads Budget Plan From upGrowth
The calculator gives you a number. What it cannot give you is confidence that the inputs are right. That requires someone who has seen your vertical, run your keyword set, and knows which CVR assumptions are realistic versus optimistic for a brand at your stage. Our paid media team at upGrowth has built and managed Google Ads accounts across SaaS, fintech, healthcare, EdTech, D2C, and enterprise verticals in India and the GCC. We have taken clients from arbitrary budgets to CAC-grounded spend models that scale without losing efficiency. Lendingkart’s growth from 56K to 87K conversions, a 54% increase with 20% business growth, did not happen by raising budgets blindly. It happened because every rupee was tied to a conversion target before it went live.
If your current Google Ads budget feels like a guess, or your ROAS has plateaued despite steady spend, book a 30-minute paid media audit with our team. We will review your account structure, CPA trajectory, and budget allocation and hand you a prioritized action list before the call ends. No pitch deck, no generic recommendations.
The most critical error is treating your budget as the starting point instead of the result of your goals. This forces you to reverse-engineer objectives to fit an arbitrary number, as seen with the fintech founder who spent Rs 4 lakh for just 11 leads. The correct approach anchors every financial decision to a specific conversion target.
This goal-first methodology requires a shift in the order of operations:
Define Success First: Start with your monthly conversion goal (e.g., leads, transactions) and your maximum acceptable cost-per-acquisition (CPA).
Calculate Required Clicks: Use your landing page conversion rate to determine how many clicks you need to hit your goal. The formula is: Required Clicks = Monthly Conversion Goal / Landing Page Conversion Rate.
Determine Budget from Clicks: Multiply the required clicks by the average cost-per-click (CPC) in your vertical. The output is your required budget, not a number picked from a competitor estimate.
By following this sequence, your ad spend becomes a direct reflection of your business ambition. This model is how Lendingkart grew conversions by 54%, proving its effectiveness at scale. To see how these inputs generate a defensible budget for your specific scenario, explore the full framework.
Goal-driven budgeting is a framework where your ad spend is the calculated output of your conversion goals, not an arbitrary input. This ensures your financial commitment is mathematically linked to desired business outcomes, like leads or sales. It prevents wasteful spending by forcing a clear rationale for every budget allocation before a campaign even launches.
The process works by reversing the typical workflow. Instead of asking 'What is my budget?', you ask 'What must I spend to achieve my goal?'. This involves defining your conversion target, target CPA, landing page conversion rate, and average CPC. The budget is calculated based on these variables. This disciplined approach was used to help Lendingkart increase total conversions to 87K, demonstrating a direct link between strategic budgeting and performance growth. The full article details the formulas that connect these critical inputs to a defensible budget.
A budget calculator provides a forecast, but Quality Score (QS) determines your real-world costs. QS is Google's rating of the quality and relevance of your keywords and ads, and a higher score leads to lower prices and better ad positions. Fixing a poor Quality Score is the highest-leverage activity for reducing your required budget.
A low QS means you pay a premium for each click. As the content notes, improving your QS from a 4 to a 7 can reduce your effective CPC by 30-45%. This means the budget output from any calculator would shrink by that same margin without sacrificing your conversion goal. For example, if your calculated budget is Rs 4 lakh, a strong QS could help you achieve the same results for as little as Rs 2.2 lakh. Focusing on ad relevance and expected click-through rate before setting a budget ensures your financial plan is built on a foundation of efficiency. Learn more about the components of QS in the complete guide.
Lendingkart achieved its 54% conversion growth by reversing its budgeting logic. Instead of starting with a fixed budget and hoping for the best, their strategy was anchored to a specific conversion target. This structural change reframed ad spend as an investment directly tied to acquiring a target number of conversions.
This goal-first model ensured every decision was made to support their primary objective. The process involved:
Setting a Clear Goal: The campaign began with a defined target for total conversions, moving from 56K to a new goal.
Calculating Requirements: They determined the necessary clicks and impressions needed to hit that conversion number based on historical performance data.
Budgeting as an Output: The budget was then calculated as the cost required to generate those clicks, rather than being an arbitrary cap.
This removed guesswork and aligned the paid media team's efforts with tangible business growth. The 20% overall business growth reported alongside the conversion lift highlights how this strategic shift has a wider impact. The full post provides the formulas to replicate this successful approach.
A company advertising in both India and the GCC must segment its budget calculations entirely. The cost of advertising in these two regions is dramatically different, and blending the CPCs will lead to severe under-budgeting for the UAE and misallocated funds in India. A unified budget strategy is a mistake that guarantees inefficiency.
The article highlights that GCC markets have CPCs 2.5 to 3.5 times higher than India. For example, a competitive fintech query might cost Rs 90 to Rs 220 in India, while a similar query in the UAE could be AED 18 to AED 35 (approximately Rs 400 to Rs 780). If you used a blended average, your UAE campaigns would run out of budget almost immediately, while your Indian campaigns might be overfunded relative to their potential. Run two separate calculations, one for each geography, using the appropriate local CPC benchmarks to build an accurate and effective media plan. Discover more regional benchmarks in the full analysis.
A B2B SaaS startup can establish a logical starting budget by treating the calculator as the final step in a strategic process. This method replaces guesswork with data-driven planning. The key is to define your unit economics before you even consider the total spend.
Follow this implementation plan:
Set Your Goal: The target is 100 qualified leads per month.
Estimate Conversion Rate: If your new landing page has no data, start with a conservative estimate, like 1.5% (the industry median is 2.35%). This means you need approximately 6,667 clicks (100 / 0.015).
Research Your CPC: For Indian B2B SaaS, high-intent keywords average Rs 120 to Rs 280 per click. Use a starting figure like Rs 180.
Calculate Core Budget: Multiply required clicks by your estimated CPC: 6,667 clicks x Rs 180/click = ~Rs 12 lakh.
Add a Buffer: Add a 15% buffer for auction volatility, bringing the total recommended budget to approximately Rs 13.8 lakh per month.
This data-backed number provides a strong rationale for your marketing investment. The full guide explains how to refine these inputs as you gather more campaign data.
A low landing page conversion rate dramatically inflates your required ad budget and is a signal to fix your funnel before scaling spend. If the median conversion rate is 2.35% and yours is 0.9%, you will need more than double the clicks and budget to achieve the same conversion goal. Pouring money into a leaky funnel is the fastest way to burn through cash with poor results.
The calculator is a diagnostic tool as much as a planning one. A high budget output caused by a low conversion rate points to problems that ads alone cannot solve. Before finalizing your budget with the calculator, you should:
Analyze User Experience: Is the page slow, confusing, or not mobile-friendly?
Refine Your Offer: Is the value proposition clear and compelling?
Strengthen Ad Scent: Ensure the message from your ad to your landing page is perfectly consistent.
By improving your conversion rate first, the budget required to hit your goals, as calculated by the tool, will decrease substantially. The story of the founder spending Rs 4 lakh for 11 leads likely involved a low-conversion-rate problem.
The founder's fundamental mistake was setting the budget based on a competitor estimate rather than their own cost-per-acquisition (CPA) target. This error in sequencing meant the Rs 4 lakh budget had no connection to a specific, desired business outcome. The budget was an input based on external factors, not an output based on internal goals.
A goal-based calculator would have forced a different conversation. Instead of starting with 'spend Rs 4 lakh', the process would start with 'we need X leads at a maximum CPA of Y'. For example, if their target CPA was Rs 10,000, the goal would be 40 leads, not 11. The calculator would then determine the required clicks and budget to hit that target, revealing if the goal was realistic. This approach, which helped Lendingkart grow conversions by 54%, connects spending directly to performance and prevents overspending on underperforming campaigns.
To set a minimum viable test budget, you should work backward from the data requirements of Google's Smart Bidding algorithms. These systems need a baseline number of conversions to learn and optimize effectively. The guidance is to aim for at least 30 conversions per month for the algorithm to exit its 'learning' phase.
This provides a simple formula for your test budget:
Minimum Test Budget = Target CPA x 30 Conversions
For example, if your company's target CPA is Rs 2,000, your minimum viable monthly budget to properly test a Smart Bidding strategy would be Rs 60,000 (Rs 2,000 x 30). Starting with a smaller budget may not provide enough data for the algorithm to perform, leading you to incorrectly conclude that the campaign is not viable. This data-driven threshold ensures you are giving your campaigns a fair chance to succeed from the outset. You can explore more advanced bidding strategies in the full article.
Marketing leaders must anticipate that rising CPCs will increase the cost of acquiring customers, requiring a strategic focus on efficiency over volume. As markets mature and advertiser density grows, like in the Indian fintech space where CPCs are already Rs 90 - Rs 220, you can no longer rely on simply increasing your budget. Your primary strategic adjustment should be to improve the underlying efficiency of your entire funnel.
To prepare for this future, you should prioritize:
Improving Quality Score: A higher QS directly lowers your CPC, acting as a deflationary measure against market-wide price hikes.
Increasing Conversion Rates: Optimizing your landing pages means you need fewer clicks (and less budget) to achieve the same number of conversions.
Expanding to Lower-Cost Channels: Diversify your media mix to channels with less competition to balance your overall portfolio CPA.
By focusing on these controllable factors, you can protect your lead volume and ROI even as the cost of visibility on Google Ads continues to climb. The complete analysis offers more detail on vertical-specific trends.
The calculator's logic is built on five interconnected inputs that translate your business goals into a required ad spend. Each input acts as a lever that directly influences the final budget output, making the relationship between ambition and cost transparent. The model ensures your budget is a direct reflection of your strategic targets.
The five required inputs are:
Monthly Conversion Goal: The total number of leads or transactions you aim to achieve.
Target CPA or ROAS: Your maximum acceptable cost per conversion or desired return on ad spend.
Landing Page Conversion Rate: The percentage of visitors who complete the desired action.
Average CPC: The estimated cost-per-click for your keywords and vertical.
Active Campaign Days: The number of days your campaigns will run in the month.
The monthly goal and conversion rate determine the number of clicks you need, while the average CPC, like the Rs 120 - Rs 280 for B2B SaaS in India, determines the cost of those clicks. The full article provides the exact formulas used.
The 15% buffer is a contingency fund designed to account for the natural fluctuations in the Google Ads auction. Your average CPC is a median, not a fixed price; real-time costs can be higher on certain days or times due to increased competition. This buffer acts as a crucial safeguard against under-budgeting and ensures campaign consistency.
Without this cushion, your campaigns are at risk of exhausting their daily budget too early, especially on high-traffic days. For a campaign with a core calculated budget of Rs 4 lakh, the 15% buffer adds an additional Rs 60,000, bringing the total to Rs 4.6 lakh. This extra allocation provides the flexibility needed to remain competitive when bids spike, preventing your ads from disappearing during crucial moments. It transforms your budget from a rigid ceiling into a more resilient and realistic spending plan. The full text explores other factors that can influence daily spend.
Amol has helped catalyse business growth with his strategic & data-driven methodologies. With a decade of experience in the field of marketing, he has donned multiple hats, from channel optimization, data analytics and creative brand positioning to growth engineering and sales.
In This Article
Download The Free Digital Marketing Resources
[slide-anything id="15651"]
We plant one 🌲 for every new subscriber.
Want to learn how Growth Hacking can boost up your business?

 Growth Strategy and Planning
 Inbound Growth
 Growth Hacking
 Fractional CMO
 Search Engine Optimization
 Paid and Performance Marketing
 Social Media Marketing
 Demand Generation
 AI-Driven Growth Strategy
 AI-Native Workflow Automation
 Generative Engine Optimization
 Grove — AI Growth Strategist

 AI Automation
 Framework
 Case Study
 Tools
Tools Growth Tools
 Decision Tree
 Compare
 Custom GPT's
 AI Answer Gap
 Offer
Offer Webstories
 Quizzes
 Blog
Blog AI-powered Apps
 Social Media Tools
 Agency Fit Score