Indian B2B SaaS companies at Rs 10-30 Cr ARR spend Rs 1.2L-2.5L to acquire each customer, with LTV:CAC ratios of 2.5-3x and payback periods of 14-20 months. CAC rises as you scale (Rs 2L-5L at Rs 60-100 Cr ARR) but efficiency improves (LTV:CAC 3-5x, payback 10-14 months). US benchmarks don’t apply because Indian ACVs are 40-60% lower while sales cycles stay comparable.
In This Article
Share On:
A founder running a Rs 28 Cr ARR vertical SaaS in Bengaluru asked me last month whether his CAC of Rs 2.1L was healthy. He had been comparing himself to SaaS Capital’s US median of $6,800 and concluded he was crushing it. Then his lead investor asked for LTV:CAC at next board prep and the number came in at 2.2x. Suddenly the same CAC looked broken.
This is the trap with imported benchmarks. Indian B2B SaaS operates on different unit economics. ACVs are 40-60% lower. Sales cycles stay similar (3-9 months for mid-market, 9-18 months for enterprise). Labour costs are lower but cloud, paid media, and good sales talent aren’t. When you copy US CAC ratios without adjusting for Indian ACV reality, you either burn capital chasing a phantom target or declare victory on numbers that won’t survive Series B diligence.
The benchmarks below come from 150+ client engagements at upGrowth Digital across Indian B2B SaaS, fintech, and vertical software companies in the Rs 10-100 Cr ARR band. They’re calibrated for Indian GTM realities, not translated from US decks.
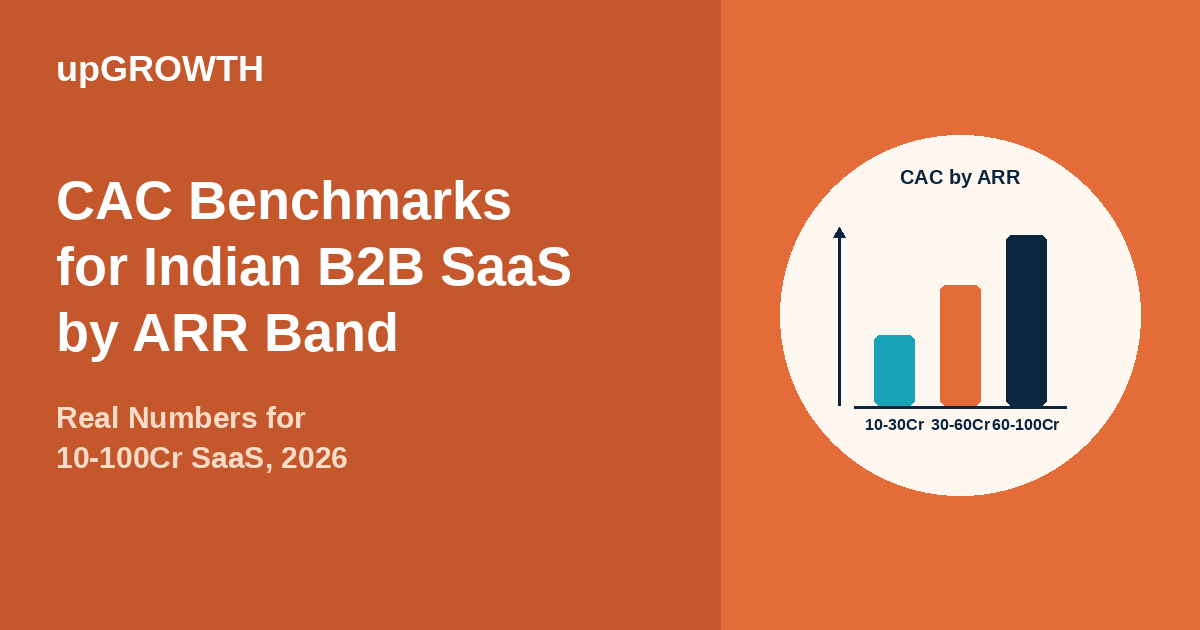
CAC Benchmarks by ARR Band: The India 2026 Numbers
This is the table most founders, CMOs, and investors should anchor to. Numbers are blended CAC (all channels, all motions) for Indian B2B SaaS selling into India and GCC markets. Pure-play global SaaS selling into the US will see different numbers (typically 2-3x higher CAC but also 2-3x higher ACV).
ARR Band
Blended CAC (INR)
LTV:CAC
CAC Payback
Typical ACV
Rs 10-30 Cr (early growth)
Rs 1.2L – 2.5L
2.5x – 3x
14 – 20 months
Rs 4L – 8L
Rs 30-60 Cr (scaling)
Rs 1.5L – 3.5L
3x – 4x
12 – 16 months
Rs 6L – 15L
Rs 60-100 Cr (efficient growth)
Rs 2L – 5L
3.5x – 5x
10 – 14 months
Rs 10L – 30L
Three things worth noting about this table. First, CAC rises in absolute terms as you scale, which sounds counterintuitive but reflects the shift from inbound-heavy to outbound-plus-ABM motions required at higher ACVs. Second, efficiency (LTV:CAC and payback) improves with scale because ACV grows faster than CAC. Third, the ranges are wide because vertical, ICP, and GTM motion matter more than ARR band alone.
The pattern isn’t random. Each ARR band has a dominant GTM motion, and motion drives cost structure.
Rs 10-30 Cr (early growth). You’re still in product-led or founder-led sales motion. CAC is lower in absolute terms because content, SEO, and founder-led outbound carry the load. But ACVs are also lower (Rs 4-8L), so LTV:CAC compresses. Payback stretches to 14-20 months because you’re selling to SMBs and early mid-market who churn faster and expand slower.
Rs 30-60 Cr (scaling). This is the hardest band. You’re building an AE-led motion, hiring SDRs, layering in LinkedIn ABM, and often adding a partnerships channel. CAC goes up because you’re paying fully loaded sales salaries plus media spend plus tooling. But ACV also climbs as you move upmarket. The Rs 30-60 Cr band is where most Indian SaaS companies either break through to capital efficiency or burn out trying to mimic US playbooks.
Rs 60-100 Cr (efficient growth). You’ve found your ICP, your CAC-to-ACV ratio is sustainable, and you’re layering in brand and category-creation spend. CAC looks scary in absolute terms (Rs 2L-5L) but LTV:CAC is 3.5-5x and payback is under 14 months. This is the band where investors start treating you like a real SaaS company instead of a Series A bet.
Channel-Level CAC Breakdown for Indian B2B SaaS
Blended CAC hides the story. Channel-level CAC tells you where to lean in and where to cut. Typical 2026 ranges across our Indian B2B SaaS client base:
Channel
CAC Range (INR)
Best Fit ARR Band
Content, SEO, GEO
Rs 40K – 80K
10-30 Cr
Paid (LinkedIn, Google)
Rs 1.5L – 3L
30-60 Cr
Outbound/SDR
Rs 2L – 4L
30-100 Cr
ABM (tier 1 accounts)
Rs 5L – 12L
60-100 Cr
Partnerships, Channels
Rs 50K – 1.5L
All bands
Events, Field Marketing
Rs 1.5L – 4L
30-100 Cr
Content, SEO, and GEO remain the cheapest channels per customer in India, but the lead time is 6-12 months before CAC drops meaningfully. Paid LinkedIn and Google look expensive on a CAC basis, but they’re predictable and can be scaled on demand, which matters when the board wants visibility into pipeline.
The mistake most Indian SaaS founders make is over-indexing on outbound because it looks like “real” B2B selling. Outbound CAC at Rs 2-4L only pencils out when ACV clears Rs 8L. Below that, the math breaks and you’re just burning SDR salaries.
LTV:CAC Ratio: The Number That Actually Matters Most
Raw CAC is vanity. LTV:CAC is sanity. The ratio tells you whether your business model works.
For Indian B2B SaaS in the Rs 10-100 Cr band, the investable LTV:CAC thresholds are:
Below 2x: You’re acquiring customers at a loss. Either your CAC is too high, your retention is broken, or your pricing is wrong. This is a red flag for any serious investor.
2x – 3x: Survivable but fragile. Acceptable for very early stage (pre-Rs 10 Cr ARR) but concerning above that. Indicates you’ll need continuous capital to scale.
3x – 4x: Healthy. This is the target for most Indian B2B SaaS at Rs 30-60 Cr ARR. Signals you can scale without constantly raising.
4x – 5x: Excellent. Typical of mature vertical SaaS with strong retention and expansion. This is where Indian SaaS companies start getting premium multiples.
Above 5x: Either you’re underinvesting in growth (leaving money on the table) or you have unusually strong network effects. Worth investigating either way.
The LTV calculation matters. Use gross margin-adjusted LTV, not revenue LTV. A Rs 10L ARR customer with 85% gross margin and 5-year retention gives you LTV of Rs 42.5L, not Rs 50L. Investors who know SaaS will calculate this themselves, so anchor on the right number from the start.
Payback period answers a simpler question: how many months of gross profit does it take to recover what you spent to acquire a customer? This is what cash-constrained founders should obsess over, especially in bridge-round or down-round environments.
Indian B2B SaaS payback benchmarks:
Under 12 months. World class. You can self-fund growth from operating cash flow. Rare in Indian SaaS below Rs 60 Cr ARR.
12-18 months. Healthy. This is the target for most Indian B2B SaaS. Enables moderate capital efficiency.
18-24 months. Acceptable for early-stage (Rs 10-30 Cr) but concerning above that. Requires continuous fundraising.
Over 24 months. Warning signal. Either fix CAC or fix pricing, because capital markets won’t bail you out indefinitely.
Indian SaaS companies that focused on payback period over growth rate during the 2023-2024 funding winter are the ones that survived with clean cap tables. Payback is the leading indicator of whether your unit economics are real or cosmetic.
Why Indian CAC Is Lower But Not Always Better
Indian B2B SaaS CAC is 40-60% lower than US peers in absolute INR terms. This sounds like good news until you realize Indian ACVs are 40-60% lower too. The ratios end up roughly similar once you adjust for purchasing power.
What actually differs is the mix of what’s cheap versus what’s not. Talent is cheaper (a senior AE in India costs Rs 25-35L fully loaded versus $180K+ in the US). But paid media is not cheaper. LinkedIn CPMs to Indian decision-makers run higher than you’d expect because the audience pool is smaller and more advertiser-crowded. Google CPCs for B2B SaaS keywords can hit Rs 400-1,200 per click for competitive terms, which isn’t meaningfully cheaper than US equivalents.
The correct mental model: Indian B2B SaaS can build cheaper sales teams and cheaper content operations, but spends roughly the same on paid media as US companies for equivalent audience quality. If your CAC is dominated by sales salaries, you’ll look cheap versus US benchmarks. If it’s dominated by paid media, you’ll look expensive relative to your ACV.
How to Measure Your CAC Correctly
Most Indian B2B SaaS companies calculate CAC incorrectly. Common mistakes and the fixes:
Mistake 1: Excluding sales salaries. CAC should include fully loaded cost of every person in marketing and sales, including SDRs, AEs, CSMs, and marketing hires. If you’re only counting paid media spend, you’re understating CAC by 40-70%.
Mistake 2: Blending paid and organic new customers. Organic customers have materially lower CAC than paid. Track both separately so you know which lever to pull.
Mistake 3: Counting expansion revenue in LTV but not expansion-related CAC. If you have a CSM team driving expansion, their cost is an expansion CAC, not a new-logo CAC. Separate them.
Mistake 4: Using trailing 30-day spend with trailing 30-day new customers. Sales cycles in Indian B2B SaaS run 3-9 months. Customers acquired today were influenced by spend 3-9 months ago. Use a blended attribution window that matches your sales cycle.
Mistake 5: Ignoring fully-loaded cost of founder-led sales. If the founder closes 40% of deals, their time has a cost, even if no one’s writing them a paycheck for sales work. Include it.
Fix these five and your CAC number will look uglier in the short term but will actually be defensible in diligence, investor updates, and internal planning.
Red Flags That Mean Your CAC Is Broken
Regardless of ARR band, these five signals mean something’s wrong with your acquisition economics:
Flag 1: LTV:CAC below 2x for more than two consecutive quarters.
Flag 2: CAC payback over 24 months while ARR growth rate is below 40% YoY.
Flag 3: Paid CAC rising faster than organic CAC without corresponding ACV growth.
Flag 4: Over 50% of new logo CAC coming from a single channel (concentration risk).
Flag 5: Customer churn in year one above 15% annualized (means your CAC is being paid for customers you’re losing before payback).
Any one of these is fixable. Two or more usually signal a deeper GTM problem that requires strategic intervention, not tactical optimization.
How to Lower CAC Without Killing Growth in India
The reflexive answer is “spend less on paid media.” This is usually wrong. The right answer depends on which lever you can actually move.
Increase conversion rate on existing paid spend before cutting it. A 30% improvement in demo-to-close conversion reduces effective CAC by 30% without reducing pipeline volume. Invest in sales enablement, better qualification, and tighter ICP targeting.
Shift from pure paid to content and GEO-led inbound gradually. Content compounds. A Rs 6L/month investment in GEO and content can generate 40-60% of qualified pipeline within 12-18 months, dragging blended CAC down materially. This is why we push clients to build GEO strength even when they’re paid-media dominant today.
Raise ACV. Doubling ACV with the same CAC doubles LTV:CAC. Indian SaaS founders under-price constantly because they benchmark against local competition rather than value delivered. Premium pricing with premium positioning is often the single highest-leverage move for improving unit economics.
Improve retention. Every point of gross revenue retention improvement adds a multiple to LTV. If your LTV:CAC is 2.5x and you push retention from 85% to 92%, the ratio jumps to 3.5-4x without touching CAC.
Six Common Questions About CAC Benchmarks for Indian SaaS
Q: What’s a good CAC for a Rs 15 Cr ARR Indian B2B SaaS company?
A: Healthy blended CAC for Rs 10-30 Cr ARR Indian B2B SaaS ranges from Rs 1.2L to Rs 2.5L. If your ACV is Rs 5L and your CAC is Rs 2L, your LTV:CAC at 5-year retention and 85% gross margin would be approximately 2.8x, which is at the lower end of healthy. Target LTV:CAC 3x or above as you scale past Rs 30 Cr ARR.
Q: Should Indian B2B SaaS companies use US CAC benchmarks?
A: No. US CAC benchmarks (typically $6,000-$15,000) come with $30,000-$100,000 ACVs. Indian ACVs for comparable products are 40-60% lower, so absolute CAC must be proportionally lower for unit economics to work. Use Indian-specific benchmarks calibrated to your ARR band and vertical.
Q: How is CAC calculated for B2B SaaS?
A: CAC = (Total sales and marketing spend in a period) divided by (Number of new customers acquired in that period). Include fully loaded personnel costs (salaries, benefits, tools), paid media, content production, events, and any attribution-worthy spend. Exclude existing-customer CSM costs unless they drive new-logo acquisition.
Q: What’s the difference between blended CAC and paid CAC?
A: Blended CAC includes all customers (organic plus paid) divided by all acquisition spend. Paid CAC isolates customers acquired through paid channels and divides by paid channel spend only. Paid CAC is usually 2-4x higher than blended CAC for B2B SaaS. Track both because they inform different decisions.
Q: How long should CAC payback be for Indian B2B SaaS?
A: Target 12-18 months for Indian B2B SaaS in the Rs 10-100 Cr ARR band. Under 12 months signals excellent capital efficiency. Over 24 months is a warning sign unless you’re in a hyper-growth phase with strong retention to compensate.
Q: Can I improve LTV:CAC without reducing CAC?
A: Yes, often faster than cutting CAC. The two highest-leverage moves are raising ACV (through better pricing or upmarket movement) and improving gross revenue retention. A 10% ACV increase plus 5 points of retention improvement can lift LTV:CAC from 2.5x to 4x without touching acquisition spend.
Your Next Move: Run a CAC Benchmark Audit
If your LTV:CAC is below 3x or your payback is over 18 months, the fix isn’t cutting spend. It’s restructuring your GTM motion to match your ARR band’s economics. That means channel mix calibration, funnel conversion tightening, and pricing review, in that order.
We’ve run this diagnostic for 150+ Indian B2B SaaS companies across the Rs 10-100 Cr band. The typical output is a 4-week sprint that identifies three specific levers (channel reallocation, conversion improvement, or pricing adjustment) with projected CAC impact in INR terms. Most sprints pay for themselves within the first quarter of implementation.
Book a CAC benchmark audit here. You’ll get Indian SaaS-specific benchmarks for your ARR band, a diagnosis of your biggest CAC leaks, and a prioritized action plan you can implement with or without us.
For Curious Minds
A healthy LTV:CAC ratio for an Indian SaaS business in this early growth stage is between 2.5x and 3x. This ratio is the ultimate measure of go-to-market efficiency because it directly links your acquisition spending to long-term customer value, preventing the common trap of celebrating a low CAC that acquires unprofitable customers. Focusing on this ratio ensures your growth is both sustainable and capital-efficient in the unique Indian market.
To properly assess health, consider:
Local ACV Reality: It correctly contextualizes spending against the 40-60% lower ACVs in India compared to the US.
Long-Term Viability: It proves you are not just buying revenue but building a profitable customer base.
Investor Confidence: It is a key diligence metric that signals a mature understanding of unit economics, as the founder of the Rs 28 Cr ARR firm discovered.
Understanding this dynamic is the first step toward building a business that can scale effectively beyond its initial traction.
Blended CAC represents your total sales and marketing expenditure divided by the number of new customers acquired, offering a vital, high-level view of your acquisition engine's overall cost. This metric naturally rises as you scale because your go-to-market motion evolves from cheaper, inbound-heavy tactics to more expensive, outbound-focused strategies required to secure larger enterprise clients. Data from upGrowth Digital shows this progression clearly, with blended CAC moving from Rs 1.2L-2.5L at the early stage to Rs 2L-5L at scale. This increase is not a sign of inefficiency but a reflection of a deliberate strategic shift. The goal is to accept a higher absolute CAC in exchange for much higher ACVs and superior unit economics, like a shorter payback period. Understanding this trade-off is fundamental to planning your company's financial future and fundraising strategy.
A founder-led motion features a lower absolute CAC but typically targets smaller deals, resulting in a modest LTV:CAC of 2.5-3x. In contrast, a mature AE-led motion requires a higher CAC, often Rs 1.5L - 3.5L, but targets larger ACVs and improves the LTV:CAC ratio to a healthier 3x-4x. The critical transition in the Rs 30-60 Cr ARR band involves investing in the AE motion to unlock scalable growth.
When comparing these motions, you should weigh the following factors:
Upfront Investment: AE-led motions require significant capital for fully loaded salaries, tools, and media spend.
ACV Potential: An AE-led structure is essential for moving upmarket to capture deals in the Rs 6L - 15L ACV range.
Scalability: Founder-led sales are not repeatable, whereas an AE-led motion is designed to scale predictably with investment.
Navigating this shift successfully is what separates companies that achieve capital efficiency from those that burn out.
For a company in the Rs 10-30 Cr ARR band, a healthy CAC payback period is between 14-20 months. This India-specific benchmark is a far more reliable indicator than US figures because it is calibrated for a market where ACVs are 40-60% lower, which naturally extends the time required to recoup acquisition costs. The founder with the Rs 2.1L CAC learned that his 2.2x LTV:CAC was weak because it pointed to a payback period outside this healthy range. Focusing on a 14-20 month payback ensures your growth is capital-efficient and sustainable within the Indian market's economic realities. Insights from upGrowth Digital confirm that companies thriving in this stage are disciplined about this metric, using it to guide their GTM investments. See how this metric should improve as you grow by reviewing the full benchmarks.
The dramatic improvement in efficiency stems from a strategic shift upmarket, where ACV growth significantly outpaces the increase in CAC. While a company in the Rs 10-30 Cr ARR band has an average ACV of Rs 4L-8L, a mature firm at Rs 60-100 Cr ARR commands ACVs of Rs 10L-30L. This leap in customer value more than compensates for the higher absolute CAC, which can reach up to Rs 5L. Evidence from upGrowth Digital's clients points to several key drivers: product maturity enables enterprise-grade features, an established brand reduces sales friction, and a refined ICP leads to higher conversion rates and lower churn. This pattern demonstrates how achieving scale unlocks superior and more sustainable unit economics.
Successful companies in this difficult growth stage avoid directly copying capital-intensive US playbooks. Instead, they build a more efficient, multi-channel GTM motion to manage the rising CAC, which can reach Rs 1.5L - 3.5L in this band. Their approach is to strategically layer channels to maximize efficiency rather than relying on a single, expensive motion.
Key adjustments include:
Building an SDR Function: Use SDRs to qualify leads and ensure that expensive AEs only work on high-potential opportunities.
Investing in LinkedIn ABM: Target high-value accounts with precision to improve conversion rates from paid spend.
Developing a Partnerships Channel: Generate a pipeline of lower-cost, high-trust leads through strategic alliances.
This balanced strategy prevents the common cash burn that occurs when companies scale an outbound team before their ACV growth can support it.
To scale efficiently, you must carefully formalize your sales process while keeping CAC within the benchmark of Rs 1.2L - 2.5L for your stage. The goal is to introduce structure and repeatability without immediately absorbing the full cost of a large enterprise sales team. A proven, phased plan involves these steps:
Codify the Founder's Playbook: Document every step of the existing successful sales process.
Hire Your First Two AEs: Have them learn directly from the founder to refine the playbook and test its transferability.
Double Down on Inbound: Continue investing in content and SEO to feed the new AEs with lower-cost leads.
Measure Relentlessly: Track channel-specific CAC and ensure your overall CAC payback period stays within the 14-20 month target.
This methodical approach, validated by data from firms like upGrowth Digital, ensures you scale your GTM without destroying your unit economics.
A high absolute CAC is justified when it yields superior unit economics and cements market leadership. You must frame the Rs 4L CAC not as a simple cost, but as a strategic investment in acquiring high-value customers with ACVs in the Rs 10L-30L range. Your narrative should shift the board's focus from absolute cost to capital efficiency and competitive dominance.
To build a compelling case, present these key metrics:
CAC Payback Period: Emphasize that you are within the highly efficient 10-14 month benchmark for your ARR band.
ACV Growth Rate: Show that the average new deal size is increasing quarter-over-quarter, proving the upmarket strategy is working.
Market Share Growth: Demonstrate that you are winning a larger share of your target ICP compared to competitors.
This data-driven story proves your marketing spend is building a durable, market-leading business, a pattern seen across successful companies analyzed by upGrowth Digital.
Founders must embed the reality of escalating CAC into their financial models from the very beginning. Simply extrapolating your early, inbound-driven CAC will create a critical funding gap just as you are trying to hit escape velocity. To prepare for this future, you should:
Model GTM Transitions: Your financial plan must explicitly account for the jump in CAC to the Rs 1.5L-3.5L range as you layer in an AE-led motion around the Rs 30 Cr ARR mark.
Raise for Payback Period: Ensure your Series A or B round provides enough runway to navigate the 12-16 month payback periods that are typical of this scaling stage.
Prioritize Expansion Revenue: Focus intensely on net revenue retention, as strong expansion can shorten your effective payback period and make higher CAC more sustainable.
This strategic foresight is crucial to avoid underestimating the capital required to cross the chasm from early growth to efficient scale.
The most critical error is adopting US CAC benchmarks and targets without adjusting for the 40-60% lower ACVs that define the Indian market. This creates a deeply flawed view of performance, as exemplified by the founder whose Rs 2.1L CAC seemed great in isolation but was revealed as inefficient by a weak 2.2x LTV:CAC ratio. To build an accurate, localized model, you must shift your focus from absolute CAC to efficiency ratios grounded in local data.
Follow these steps:
Anchor to Indian Benchmarks: Use data calibrated for India, such as a 14-20 month payback period for early-growth companies.
Prioritize Key Ratios: Make LTV:CAC and CAC Payback your primary GTM health metrics.
Segment Your Data: Analyze CAC by channel and sales motion to understand your true cost drivers.
This approach, based on real-world data from sources like upGrowth Digital, ensures you are building a genuinely sustainable business.
This trend is not a sign of inefficiency but a reflection of a deliberate investment in acquiring more valuable, enterprise-grade customers. The rising CAC is justified because it is paired with even faster growth in Average Customer Value (ACV) and a significant improvement in the LTV:CAC ratio, which moves from 2.5x to over 3.5x at scale. A higher absolute CAC is a hallmark of a healthy, scaling SaaS business, provided the unit economics improve alongside it.
Key strategic shifts that drive this include:
Moving Upmarket: Targeting larger enterprises brings higher acquisition costs but also much higher ACVs (from Rs 4L to over Rs 10L).
Adopting Enterprise GTM: Implementing sophisticated motions like ABM and field sales is expensive but necessary for large deals.
Building a Brand: Investing in category creation has a high upfront cost but creates a long-term defensible moat.
Data from upGrowth Digital confirms this is the path to building a dominant and efficient SaaS company.
This common burnout phase stems from scaling an expensive, AE-led sales team prematurely, before achieving product-market fit in a higher ACV segment. Companies try to force growth by hiring, which inflates CAC to the Rs 1.5L-3.5L range without a corresponding increase in deal size to maintain a healthy payback period. Efficient companies avoid this trap by being more disciplined. They validate the upmarket playbook with a small, senior team before committing to a full-scale hiring plan. They solve this by: 1. Layering GTM motions to blend outbound with lower-cost channels like partnerships. 2. Obsessing over the 12-16 month payback benchmark for this stage. This phased, data-driven approach ensures that investments in the sales team are matched by proven traction in more lucrative market segments.
Amol has helped catalyse business growth with his strategic & data-driven methodologies. With a decade of experience in the field of marketing, he has donned multiple hats, from channel optimization, data analytics and creative brand positioning to growth engineering and sales.
 Growth Strategy and Planning
 Inbound Growth
 Growth Hacking
 Fractional CMO
 Search Engine Optimization
 Paid and Performance Marketing
 Social Media Marketing
 Demand Generation
 AI-Driven Growth Strategy
 AI-Native Workflow Automation
 Generative Engine Optimization
 Grove — AI Growth Strategist

 AI Automation
 Framework
 Case Study
 Tools
Tools Growth Tools
 Decision Tree
 Compare
 Custom GPT's
 Guides
 Offer
Offer Webstories
 Quizzes
 Blog
Blog AI-powered Apps
 Social Media Tools
 Agency Fit Score