Contributors:
Amol Ghemud Published: October 15, 2026
Summary
The customer lifetime value calculator on this page gives SaaS founders and growth teams a fast, accurate read on how much revenue each acquired customer generates before they churn. CLV is not a vanity metric: a SaaS product with 150 USD ARPU, 70% gross margin, and 2.5% monthly churn produces a CLV of 4,200 USD, a number that should govern every acquisition budget decision you make. If your CLV:CAC ratio is below 3:1, scaling paid spend right now is not growth strategy, it is subsidised customer destruction.
In This Article
Share On:
A SaaS company spending 1,200 USD to acquire a customer who churns in four months has not grown. It has burned cash with extra steps. The unit economics were broken before the first ad went live, and no amount of creative testing or audience expansion was going to fix that.
The uncomfortable truth about most SaaS growth teams in 2026: they track MRR religiously, optimise click-through rates obsessively, and could not tell you their CLV within 30% accuracy if you asked them right now. That gap is not a reporting problem. It is a strategy problem dressed up as a metrics problem.
Understanding per-customer unit economics before scaling acquisition spend is what separates profitable growth from expensive noise. When Lendingkart sharpened its unit economics through Google Ads performance data, total conversions grew from 56K to 87K, a 54% increase, alongside business growth of 20%. The channel didn’t change. The clarity around what each converted customer was actually worth did.
The team at upGrowth Digital built this calculator for exactly that moment: when a founder or growth lead needs to know, in the next ten minutes, whether their acquisition spend is justified or catastrophically misaligned. What follows is a walkthrough of each input, the formula behind the output, and a decision tree for what to do with the number once you have it.
How to Use the Customer Lifetime Value Calculator
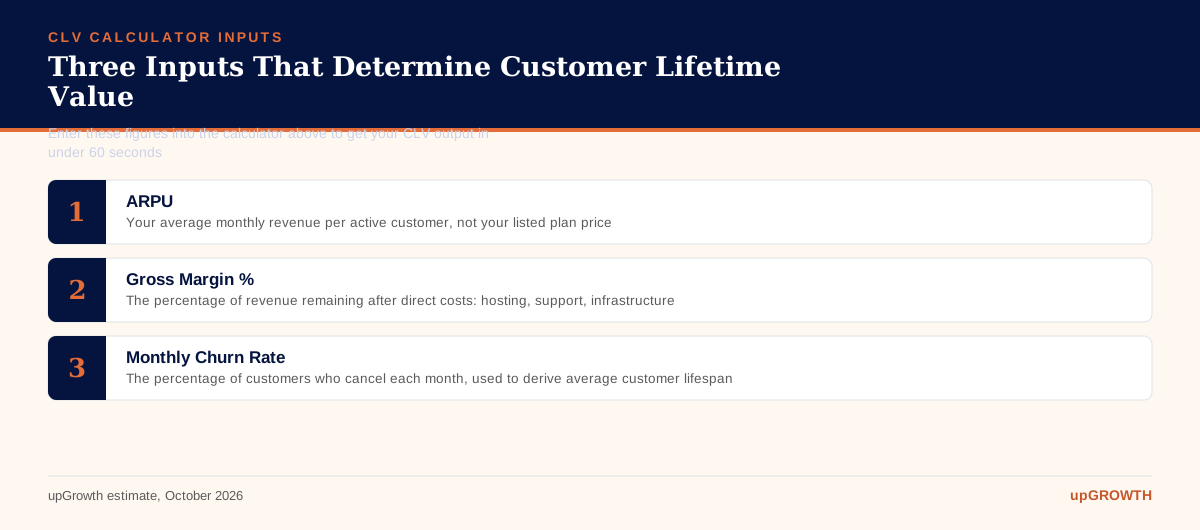
The customer lifetime value calculator above takes three inputs: your average revenue per user (ARPU) in USD per month, your average customer lifespan in months, and your gross margin percentage. Enter current figures from your active customer base, hit calculate, and the output gives you total gross profit generated per customer from first purchase to churn.
ARPU is the one most people get right. Lifespan is where it gets interesting: if you don’t have a clean cohort analysis, take 1 divided by your monthly churn rate and that gives you the implied average lifespan in months. A 2.5% monthly churn rate implies a 40-month average lifespan. Simple enough that there’s no excuse for leaving it blank.
The single most common error in CLV calculations is using monthly revenue instead of monthly gross profit as the base figure. For most SaaS products, gross margin sits somewhere between 65% and 85%. Skipping that adjustment inflates CLV by 20% to 60%, which means your acquisition budget looks justified when it isn’t. The calculator applies your stated gross margin automatically, so the output is a gross profit figure, not a revenue figure. They are not the same thing and should never be treated as such.
One practical note: if you run multiple pricing tiers or serve materially different customer segments, run the calculator separately for each. A blended company-wide CLV hides the reality that your enterprise tier might have a CLV of 80,000 USD while your SMB tier sits at 1,800 USD. Those two numbers demand completely different acquisition strategies.
What Is Customer Lifetime Value and Why Does It Matter for SaaS?
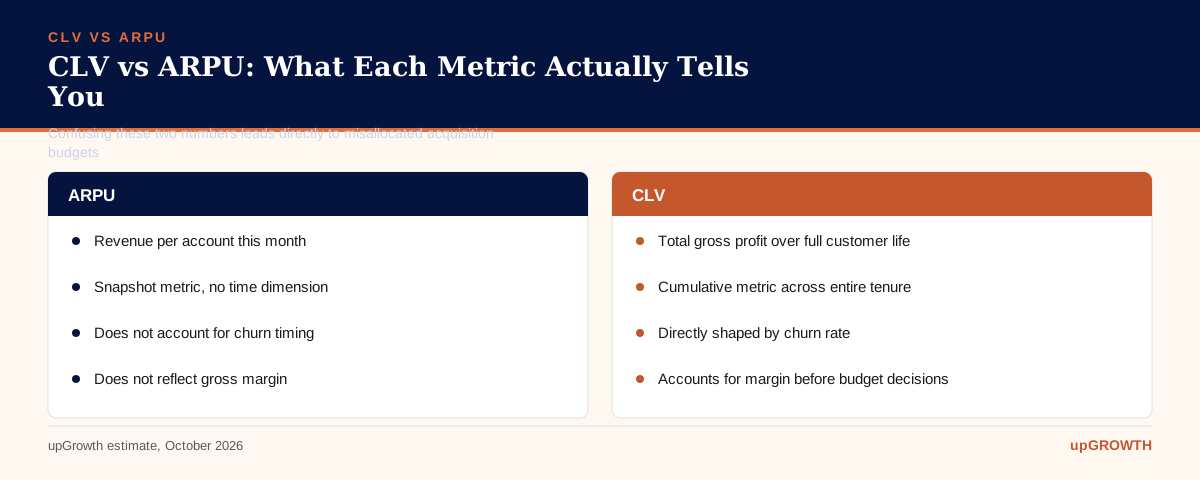
Customer lifetime value (CLV) is the total gross profit a business earns from a single customer over the entire relationship, from first payment to churn. It is not first-year revenue. It is not ARPU. It is the cumulative business value of keeping an account alive and healthy across its full tenure with your product.
ARPU tells you what a customer is worth this month. CLV tells you what that customer is worth to the business. The difference matters the moment you open your acquisition budget. If your ARPU is 200 USD but a customer churns in three months on average, you’re generating 600 USD in revenue per acquired customer, and probably less than 450 USD in gross profit, before you’ve paid a rupee toward acquiring them.
The industry benchmark that every SaaS investor and operator uses: a CLV:CAC ratio above 3:1 signals a healthy acquisition model. Between 1:1 and 3:1, you’re in warning territory. Below 1:1, the business is destroying value with every new customer it brings in, which is a peculiar way to define growth but not an uncommon one in 2026.
According to HubSpot’s marketing research, companies that actively track CLV alongside CAC make faster, more confident channel investment decisions because they have a denominator for every acquisition cost conversation. Without CLV, CAC is just a cost. With CLV, it becomes a ratio, and ratios tell you whether to accelerate or stop.
The CLV Formula Explained: Three Inputs, One Critical Output
The core formula is straightforward: CLV = ARPU x Gross Margin x (1 / Monthly Churn Rate). Three inputs, one output, and more strategic clarity than most SaaS teams get from an entire quarterly business review.
Here is a worked example to make it concrete. A SaaS product with a 150 USD monthly ARPU, 70% gross margin, and 2.5% monthly churn rate produces a CLV of 4,200 USD. The math: 150 x 0.70 = 105 USD gross profit per month per customer. 1 / 0.025 = 40 months average lifespan. 105 x 40 = 4,200 USD. If that product’s CAC is 1,400 USD, the CLV:CAC ratio is exactly 3:1, sitting right at the minimum threshold for healthy acquisition economics.
Now watch what happens when you adjust the churn lever. That same product, if monthly churn drops from 2.5% to 1.25%, sees CLV jump from 4,200 USD to 8,400 USD. CAC stays the same. Gross margin stays the same. ARPU stays the same. The only variable that changed was retention, and the CLV doubled. This is why retention is the highest-leverage CLV improvement available to most SaaS products. Price increases are politically complicated and competitively risky. Cutting churn in half is operationally difficult but doesn’t require a pricing page redesign or a board approval.
The broader principle applies beyond the formula itself: the inputs you choose to improve reveal your actual growth priorities. Teams that obsess over ARPU growth tend to invest in pricing strategy and upsells. Teams that obsess over churn invest in onboarding and customer success. The CLV formula makes the tradeoffs visible in a way that a revenue dashboard never quite does.
One more thing about this formula: it assumes a constant churn rate across the customer lifespan. Real churn is front-loaded. Most SaaS products see the highest churn in months one through three, with surviving customers churning at a much lower rate after month six. If you have cohort-level data, use it. If you don’t, the simple formula still gets you 80% of the answer, which is infinitely better than none.
How to Interpret Your CLV Output: Decision Trees for SaaS Teams
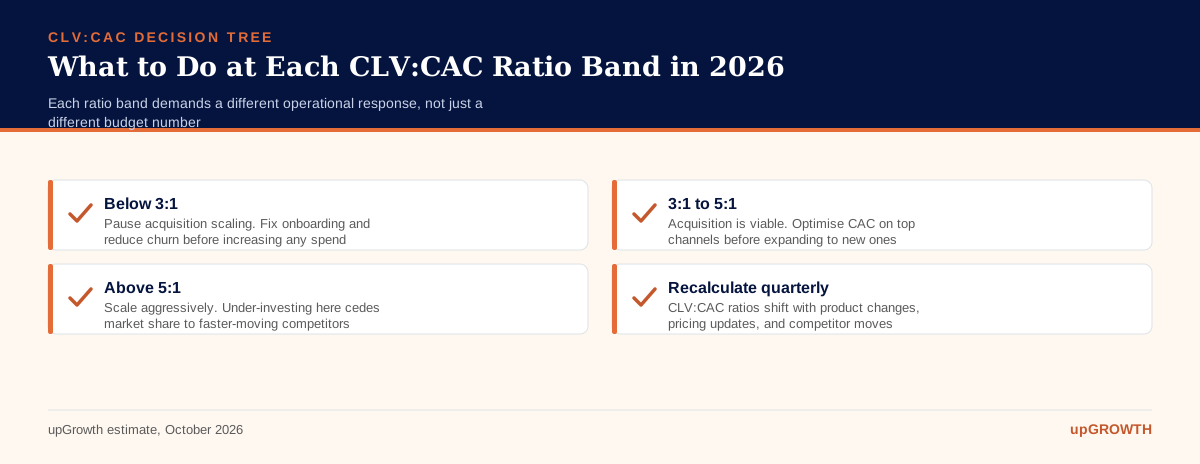
The CLV number the calculator returns is not the end of the exercise. It is the beginning of a decision. There are three bands that matter, and each one demands a different response.
CLV below 3x CAC: Do not scale paid acquisition. Full stop. Adding more spend into a broken unit economics model accelerates losses faster than it accelerates revenue. The priority here is onboarding improvement and churn reduction. Find the month where most customers disengage, fix whatever is happening there, and recalculate. Scale conversations start again only when the ratio clears 3:1.
CLV between 3x and 5x CAC: Acquisition channels are viable. The margin is real. Now the work is optimising CAC on your top-performing channels before expanding into new ones. This is the zone where most mature SaaS businesses operate, and it is a good place to be. Don’t take the ratio for granted, because competitors are trying to move into the same channels and CAC tends to inflate as channels get more competitive.
CLV above 5x CAC: This is the signal to move aggressively. You have room to increase acquisition spend, test new channels, and run experiments at a pace that would be reckless at lower ratios. The risk in this zone is under-investing and leaving market share for competitors to take. Run experiments to find the ceiling before someone else finds it for you.
These thresholds aren’t arbitrary. They reflect the capital efficiency benchmarks that SaaS-focused investors and operators have validated across thousands of businesses. Growth frameworks like those documented by Ahrefs consistently show that companies which calibrate acquisition spend to CLV data outperform those running on intuition alone, particularly in competitive markets where CAC is rising year-over-year.
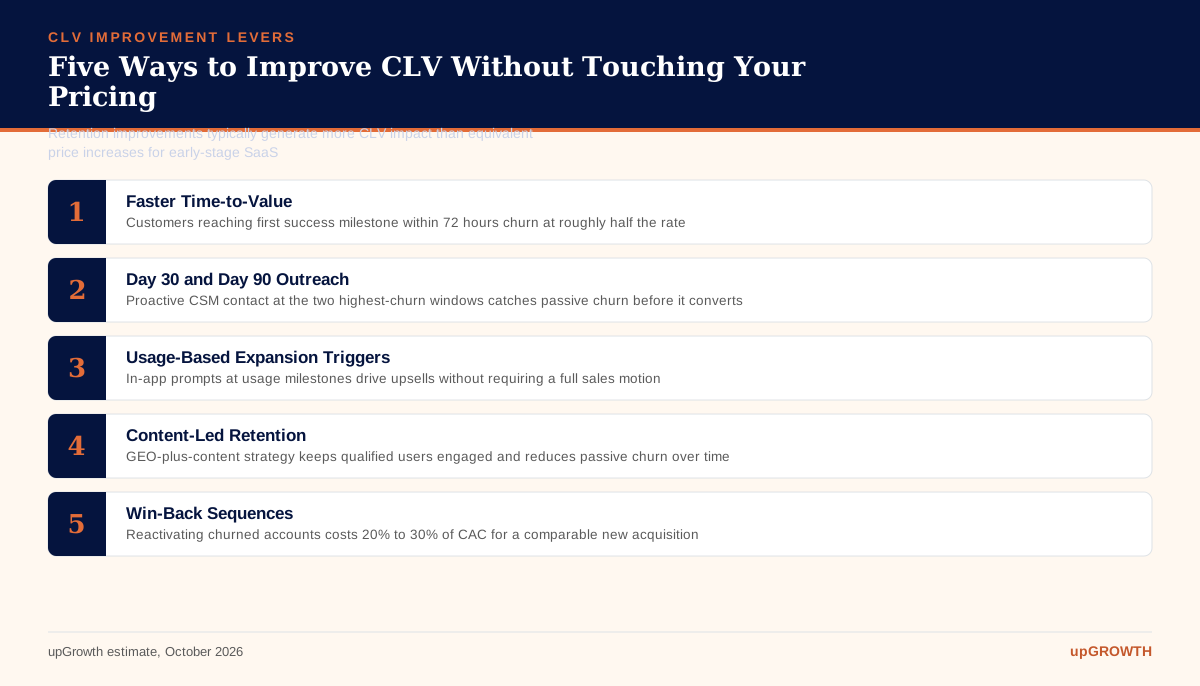
Five Ways to Improve CLV Without Changing Your Pricing
The obvious move when CLV is too low is to raise prices. The problem is that pricing changes take quarters to work through and often increase churn in the short term before they improve margins. There are faster, lower-risk levers available to most SaaS teams right now.
First: reduce time-to-value in onboarding. Customers who reach their first meaningful success milestone within 72 hours churn at roughly half the rate of those who don’t. That single operational change, shortening the time between signup and first win, has more CLV impact than most feature investments. Map your current onboarding and find where the 72-hour window gets missed most often. Fix that first.
Second: proactive customer success outreach at day 30 and day 90. These are the two highest-churn windows in most SaaS products. Most teams know this and still don’t act on it systematically. An automated outreach sequence triggered by low product engagement at those marks, personalised enough to feel human, catches passive churn before it becomes actual churn.
Third: feature-based expansion triggers. In-app prompts tied to usage milestones drive upsells without a sales motion. A user who has hit the limit on their current tier three times in a week is telling you they want to expand. Show them how.
Fourth: a content-led retention engine. The GEO-plus-content approach used for Fi.Money, where Fi.Money became the top authority for smart deposit queries in Google AI Overviews, kept qualified users actively engaged with the product’s value proposition. Content that answers users’ evolving questions reduces passive churn, the kind where customers don’t leave angry, they just quietly stop logging in.
Fifth: win-back sequences for churned accounts. Reactivation typically costs 20% to 30% of CAC for a comparable new acquisition. Most SaaS teams ignore churned accounts entirely after the first re-engagement email fails. A structured three-touch sequence over 47 days, timed around product updates or seasonal triggers, converts a meaningful subset of churned users without the full acquisition cost.
CLV benchmarks vary dramatically by segment, and comparing your SMB SaaS CLV to an enterprise SaaS benchmark is about as useful as comparing a rickshaw’s fuel efficiency to a cargo ship’s. The numbers that matter are the ones that match your actual market.
CLV Benchmarks by SaaS Segment (2026)
Segment
Typical CLV Range
Healthy CLV:CAC Ratio
CAC Payback Benchmark
SMB SaaS
1,500 to 8,000 USD
3:1 minimum
Under 12 months
Mid-Market SaaS
15,000 to 80,000 USD
4:1 to 5:1
12 to 18 months
Enterprise SaaS
200,000+ USD
3:1 or above
18 to 24 months
Fintech SaaS
Varies by product type
3:1 to 5:1
Under 18 months
SMB SaaS faces the most churn pressure of any segment. High customer volume, lower switching costs, and aggressive competitor pricing mean CLV:CAC ratios should sit at 3:1 as a floor, not a target. Mid-market products justify higher CAC because longer sales cycles, deeper integrations, and multi-stakeholder buying decisions all make customers stickier. Enterprise SaaS operates on a different calendar entirely: an 18-month CAC payback period is perfectly healthy when a contract runs three to five years.
For fintech SaaS specifically, improving per-customer unit economics can justify meaningful increases in acquisition spend. Lendingkart’s experience is instructive: by sharpening the performance data around what each converted customer was actually worth, the business achieved 20% growth alongside a 54% increase in total conversions. The investment case for scaling only becomes defensible when the unit economics are visible first.
Common CLV Calculation Mistakes That Distort Your Growth Strategy
Getting the CLV formula wrong is worse than not calculating it at all, because a wrong number inspires confident bad decisions. There are four mistakes that show up consistently across the SaaS companies we audit.
Using revenue instead of gross profit. This is the most common error and the most expensive. Hosting costs, customer support overhead, payment processing fees, and infrastructure costs all reduce the margin you actually keep from each customer’s payment. For a typical SaaS product with 75% gross margin, using revenue instead of gross profit overstates CLV by exactly 33%. That overstatement makes acquisition spend look more efficient than it is.
Applying a single company-wide churn rate. Customers acquired through organic search churn differently than customers acquired through paid social. Enterprise customers churn differently than SMB customers. Annual plan customers churn differently than monthly plan customers. A single blended churn rate flattens all of that variation into one number that accurately describes none of your segments. Run CLV by cohort, by acquisition channel, and by pricing tier. Show me a company using a single churn rate for all CLV calculations, and I’ll show you a growth strategy built on a fiction.
Ignoring expansion revenue. For SaaS products with usage-based or seat-based pricing, expansion MRR from existing customers can add 15% to 40% to true CLV. A customer who starts on a 50 USD per month plan and upgrades to 200 USD per month over 18 months has a dramatically different CLV than the initial ARPU suggests. Build expansion revenue into your model as a separate component and add it to base CLV.
Treating CLV as a static annual calculation. Product changes, market shifts, new competitors, and pricing adjustments all move churn rates. CLV calculated in Q1 2026 may be meaningfully wrong by Q3 2026 if a new entrant has accelerated competitive churn in your segment. Recalculate by cohort at minimum every quarter, and immediately after any significant change to the product, pricing, or acquisition mix. Growth strategy frameworks consistently flag static metrics as one of the top causes of misallocated acquisition spend in scaling SaaS businesses.
Common Questions About Customer Lifetime Value Calculator
What is a good customer lifetime value for a SaaS business?
A healthy SaaS CLV is typically at least three times your customer acquisition cost (CAC). For SMB-focused SaaS products in 2026, a CLV between 3,000 USD and 10,000 USD is common, while mid-market and enterprise products routinely exceed 50,000 USD per customer. The benchmark that matters most is not the absolute number but the CLV:CAC ratio, which should sit at 3:1 or above before you scale any paid acquisition channel.
How do I calculate customer lifetime value?
The standard SaaS formula is CLV = ARPU x Gross Margin x (1 / Monthly Churn Rate). For example, if your average revenue per user is 200 USD, gross margin is 75%, and monthly churn is 3%, your CLV is 200 x 0.75 x (1 / 0.03), which equals 5,000 USD. You can run this calculation instantly using the upGrowth customer lifetime value calculator above by entering those three inputs.
What inputs does the CLV calculator need?
The calculator requires three inputs: your average monthly revenue per customer (ARPU), your gross margin percentage, and your monthly churn rate. All three should reflect your current active customer base, not blended historical averages that include older pricing tiers. If you have distinct customer segments, run the calculator separately for each to get segment-level CLV rather than a misleading company-wide average.
How does churn rate affect customer lifetime value?
Churn rate is the most powerful lever in the CLV formula because it appears as a divisor. Halving your monthly churn rate doubles your CLV, all else being equal. A product moving from 4% monthly churn to 2% monthly churn sees CLV jump from 25 months of gross profit to 50 months. This is why retention improvements typically generate more CLV impact than equivalent price increases for early-stage SaaS products.
What is the difference between CLV and LTV in SaaS?
CLV (customer lifetime value) and LTV (lifetime value) are used interchangeably in most SaaS contexts and refer to the same metric: the total gross profit earned from a customer over their entire relationship with your product. Some practitioners define LTV as the revenue figure before deducting gross margin, while CLV accounts for margin, making CLV the more conservative and operationally accurate measure for budget decisions.
How often should SaaS companies recalculate CLV?
CLV should be recalculated by cohort at minimum every quarter, and immediately after any significant pricing change, product update, or shift in acquisition channel mix. Annual CLV calculations can mask rapid churn deterioration in newer cohorts. Companies that grew profitably, like Vance achieving 287% revenue growth, tend to track CLV at the cohort level monthly so that a churn signal in one segment does not get averaged away in company-wide numbers.
Can I use this CLV calculator if my SaaS has usage-based pricing?
Yes, but you need to substitute a 12-month average revenue per active customer for ARPU rather than your listed plan price. For usage-based models, ARPU fluctuates monthly, so pulling a trailing 12-month average smooths out seasonal variance. You should also add expected expansion revenue as a separate calculation and sum it with base CLV to capture the full value of accounts that grow their usage over time.
Your Next Move: Turn Your CLV Number Into a Growth Plan
You now have your CLV figure. The next question is whether your current acquisition spend and channel mix can actually be justified by that number. If your CLV:CAC ratio is below 3:1, scaling spend will accelerate losses, not revenue. If it sits above 5:1, you’re almost certainly under-investing in acquisition and handing market share to competitors who are watching the same market you are. Either way, the number demands a decision, not just a spreadsheet entry.
The upGrowth growth team works with SaaS companies across India and the GCC to translate CLV data into channel strategy. We helped Lendingkart grow total conversions from 56K to 87K and achieve 20% business growth by anchoring investment decisions in unit economics rather than instinct. We can run a CLV-to-CAC audit across your active channels and show you exactly where to accelerate and where to stop spending, within two weeks of starting.
Book a 30-minute strategy session below. Bring your CLV output from this calculator and your current CAC by channel. We’ll give you a prioritised action list before the call ends.
Customer lifetime value provides the complete economic story of a customer, shifting focus from a single month's payment to the total gross profit generated over the entire relationship. While ARPU measures your current temperature, CLV measures your long-term health. This distinction is vital for acquisition because it connects marketing spend directly to profitability, ensuring you are not paying more to acquire a customer than they are worth.
Understanding this value allows you to build a resilient business model based on proven unit economics. A SaaS company should aim for a CLV to CAC ratio greater than 3:1, a signal of a healthy and scalable acquisition engine. For example, a customer with a 2,000 USD CLV can justify an acquisition cost of up to 667 USD, a clear budget that a simple ARPU figure could never provide. This clarity is the foundation for separating expensive noise from truly profitable growth. Discover how to apply this thinking to your own numbers in the full analysis.
An accurate CLV calculation depends on three specific inputs: average revenue per user (ARPU), average customer lifespan, and gross margin percentage. Misunderstanding any of these components leads to a distorted view of your business's health. ARPU sets the baseline value, but lifespan determines the duration over which that value accumulates, while gross margin adjusts it for the real cost of service delivery.
Each input plays a distinct role:
1. ARPU: This is the monthly revenue each customer generates. It is the starting point for all value calculations.
2. Customer Lifespan: Often derived by taking 1 divided by your monthly churn rate, this multiplier extends the value beyond a single month. A 2.5% monthly churn implies a 40-month lifespan.
3. Gross Margin: This percentage refines the calculation from revenue to actual profit, which is the only figure that matters for reinvestment. Ignoring this step is the most common error. A clear grasp of these variables is the first step toward strategic financial planning.
The most common and damaging mistake is using total revenue instead of gross profit as the basis for the calculation. This simple oversight inflates your CLV, often by 20% to 60%, creating a false sense of security and justifying acquisition spending that is actually unprofitable. It makes a company believe its unit economics are healthy when they are fundamentally broken.
The upGrowth Digital calculator directly solves this by requiring you to input your gross margin percentage. It then automatically applies this figure, converting your ARPU into a gross profit per user before multiplying it by the customer lifespan. This ensures the output is a realistic profit figure, not an optimistic revenue number. This mandatory adjustment forces a clear-eyed view of what each customer is truly worth, preventing you from burning cash on acquisition channels that only appear to be working. See how this small change can completely reframe your growth strategy.
You can generate a reliable estimate of your average customer lifespan with a straightforward formula: divide 1 by your monthly customer churn rate. This gives you the implied average lifespan in months. For example, if your SaaS business experiences a 2.5% monthly churn, the calculation (1 / 0.025) reveals an average customer lifespan of 40 months. This simple method removes a major roadblock for teams without dedicated analytics resources.
Once you have this number, the next steps are clear:
1. Gather your average revenue per user (ARPU) and gross margin percentage.
2. Enter these three figures, including your calculated 40-month lifespan, into the CLV calculator.
3. Instantly receive a gross profit-based CLV, giving you an actionable metric for setting customer acquisition cost targets. This quick process transforms abstract churn data into a concrete financial North Star. The full article provides a decision tree for what to do with this number next.
Lendingkart's success demonstrates that clarity, not just activity, drives growth. By sharpening its understanding of unit economics, the company gained a precise view of what a truly valuable converted customer was worth. This allowed them to optimize their Google Ads spending with confidence, focusing budget on audiences and keywords that delivered high-CLV customers, rather than just chasing the lowest cost-per-click.
The results were a direct outcome of this strategic shift. Total conversions grew from 56K to 87K, a massive 54% lift that powered overall business growth of 20%. The marketing channel remained the same, but the economic intelligence guiding the investment changed completely. Instead of guessing, they operated with a clear mandate on how much they could profitably spend to acquire a customer. This case shows how mastering your numbers is a more powerful lever than simply testing more ad creative.
Calculating a single, blended CLV for a multi-segment SaaS business is a critical error because it masks the massive variance in value between customer tiers. A blended average hides the reality that your enterprise clients might have a CLV of 80,000 USD while your SMB tier sits at 1,800 USD. This unified number encourages a one-size-fits-all acquisition strategy that is inefficient for both segments.
You should treat each segment as a separate business unit with its own unit economics. This means running the CLV calculation independently for each tier and developing tailored acquisition strategies. The high-value enterprise segment justifies a high-touch, account-based marketing approach with a much higher customer acquisition cost (CAC). Conversely, the lower-value SMB segment requires a low-touch, highly automated marketing funnel with a strictly controlled CAC. This segmentation is key to allocating resources effectively and maximizing profitability across your entire customer base.
As the SaaS market matures and competition intensifies, customer acquisition costs will continue to rise, making economic efficiency the primary determinant of success. Teams focused on MRR growth alone will find themselves in a dangerous position, celebrating top-line gains while their profitability erodes. They risk acquiring entire cohorts of customers who cost more to bring in than they will ever generate in gross profit.
Conversely, teams that master CLV will possess a decisive strategic advantage. They can confidently invest in the right channels, target the most profitable customer segments, and build a resilient business model that can withstand market pressures. The long-term consequences for companies that fail to adapt are severe: they will burn through venture capital without building sustainable value, face down rounds, or become acquisition targets for more disciplined competitors. In this environment, understanding your unit economics is not just good practice; it is a matter of survival.
Focusing solely on metrics like click-through rates (CTR) creates a strategic blind spot where marketing activity is mistaken for business impact. A high CTR is meaningless if it attracts users who churn quickly or belong to a low-value segment. The CLV:CAC ratio solves this by connecting the entire marketing funnel, from the first click to the final month of subscription, to a single, powerful profitability metric.
Anchoring your team to this ratio forces a crucial shift in thinking. Instead of asking, "How can we get more clicks?" the team starts asking, "How can we acquire more customers we can retain profitably?" This aligns marketing, sales, and product development around the shared goal of creating long-term value. It moves the focus from top-of-funnel vanity metrics to the fundamental unit economics that determine whether the business is growing or just spending. Learn more about how to embed this metric into your team's workflow.
The 3:1 CLV:CAC ratio serves as a clear, data-driven threshold for making critical decisions about growth investment. It provides an objective measure of your acquisition model's health and efficiency. A company with a ratio well above 3:1, for example at 4:1, has a proven, profitable engine and should feel confident aggressively scaling its marketing spend to capture more market share.
Conversely, a ratio between 1:1 and 3:1 is a strong signal to proceed with caution. This indicates that while you may be profitable, your margins are not robust enough to withstand market shifts or scaling inefficiencies. In this scenario, the priority should be improving the business model by increasing CLV (through better retention or pricing) or reducing CAC (through channel optimization). A ratio below 1:1 is an urgent alarm to halt spending entirely, as you are losing money on every new customer. The ratio acts as a simple but powerful governor on your growth ambitions.
The CLV calculator's output is the foundational data point for an effective strategic decision tree. By comparing your calculated CLV to your customer acquisition cost (CAC) for a specific channel, you can immediately determine the correct course of action. This transforms ambiguous performance data into a clear, actionable plan.
Here is a simple three-point decision tree:
1. CLV:CAC is above 3:1: Scale the campaign. The channel is delivering profitable customers, and you have a green light to increase investment to accelerate growth.
2. CLV:CAC is between 1:1 and 3:1: Optimize for efficiency. The campaign is borderline. Pause scaling and focus on improving targeting, ad creative, or landing page conversion to lower CAC, or work with the product team to improve retention and lift CLV.
3. CLV:CAC is below 1:1: Halt the campaign. You are actively losing money. The channel or the strategy is broken and requires a fundamental reassessment before another dollar is spent.
Adopting CLV as a North Star metric forces a profound strategic shift from a transactional to a relational mindset. While ARPU provides a valuable monthly snapshot, it incentivizes short-term actions to maximize immediate revenue. A focus on CLV, however, rewards a long-term perspective, as its two key levers are increasing customer value and extending customer lifespan.
This reorients the entire organization. Instead of just optimizing for initial conversion, teams become invested in the full customer journey. It elevates the importance of functions like customer success, support, and product engagement, as they are directly responsible for reducing churn and creating expansion opportunities. A company obsessed with CLV doesn't just acquire customers; it cultivates valuable, long-term partners, building a more resilient and profitable business in the process. This deeper focus on the customer relationship is explored further in the article.
In an increasingly discerning investment climate, a deep understanding of unit economics is no longer a bonus; it is a prerequisite for securing capital. Investors are shifting their focus from pure top-line growth to evidence of sustainable, profitable growth. A startup that can only present impressive MRR charts without a clear grasp of its CLV and CLV:CAC ratio will face intense scrutiny and skepticism.
Startups that can articulate a clear, data-backed story around their per-customer profitability will command higher valuations and greater investor confidence. They demonstrate a mature and disciplined approach to building a business, not just buying revenue. The ability to show segmented CLV, a healthy CLV:CAC ratio, and a clear payback period is now a key differentiator. Failing to master these metrics will be perceived as a strategic weakness, directly impacting a company's ability to attract the funding needed to scale.
Amol has helped catalyse business growth with his strategic & data-driven methodologies. With a decade of experience in the field of marketing, he has donned multiple hats, from channel optimization, data analytics and creative brand positioning to growth engineering and sales.
In This Article
Download The Free Digital Marketing Resources
[slide-anything id="15651"]
We plant one 🌲 for every new subscriber.
Want to learn how Growth Hacking can boost up your business?

 Growth Strategy and Planning
 Inbound Growth
 Growth Hacking
 Fractional CMO
 Search Engine Optimization
 Paid and Performance Marketing
 Social Media Marketing
 Demand Generation
 AI-Driven Growth Strategy
 AI-Native Workflow Automation
 Generative Engine Optimization
 Grove — AI Growth Strategist

 AI Automation
 Framework
 Case Study
 Tools
Tools Growth Tools
 Decision Tree
 Compare
 Custom GPT's
 AI Answer Gap
 Offer
Offer Webstories
 Quizzes
 Blog
Blog AI-powered Apps
 Social Media Tools
 Agency Fit Score